

How AI Makes the Hidden Cost of Poor Quality Visible
Executive Summary
Cost of Poor Quality (COPQ) has long been described as an iceberg: a small visible portion of scrap, rework, warranty claims, and returns above the waterline, and a much larger set of hidden costs below it. That model remains useful, but it can also be misleading when leaders treat the hidden portion as a generic estimate rather than a measurable business risk.
AI-enabled inspection changes the discussion. By moving from statistical sampling and inconsistent manual checks toward continuous, data-driven inspection, companies can reduce uncertainty, expose defect patterns earlier, and make more deliberate choices about the level of quality their brand represents. The strategic question is no longer whether AI will influence quality management, but which companies will use it first to convert quality visibility into competitive advantage.
Why detection rate is not the same as business visibility
In a previous article, I discussed how statistical sampling can create a false sense of confidence in quality control and how AI is beginning to change that equation. This article takes a broader business view: what happens when the defects we do not see become more important than the defects we measure?
Most executives are familiar with COPQ. They have also seen the classic iceberg illustration suggesting that only a small fraction of quality cost is visible while the largest losses remain hidden in customer dissatisfaction, operational disruption, lost sales, and brand erosion.
The problem is not the iceberg metaphor itself. The problem is how often it is used as a dramatic warning rather than as a practical management tool. Leaders do not need another abstract claim that poor quality may consume a large share of revenue. They need a way to understand where the risk is, how much of it is visible, and what can be done to make better decisions.
Is the cost of poor quality iceberg model still accurate?
The classic cost of poor quality model remains a helpful starting point because it reminds organizations that the most obvious quality costs are rarely the full cost.
Visible costs typically include scrap, rework, warranty claims, returns, and direct remediation. Hidden costs may include expedited freight, overtime, production disruption, excess inventory, lost productivity, dissatisfied customers, reputational damage, and lost future revenue.
Traditional cost-of-quality frameworks, as defined by ASQ, also distinguish between prevention, appraisal, internal failure, and external failure. The principle is simple: investments that prevent or detect defects earlier are usually less costly than failures discovered after the product reaches the customer. The executive challenge is that external failure is often the least visible category and one of the most damaging.
That is why generic COPQ percentages should be treated with caution. The magnitude and visibility of poor quality vary significantly by industry, product risk, inspection method, customer behavior, and regulatory context.
How does the cost of poor quality differ by industry?
Not all industries experience quality escapes in the same way. A defect in aerospace, medical devices, consumer goods, food, software, or metallurgical components has a different probability of detection, a different customer impact, and a different economic consequence.
This distinction matters because many industries do not publish clean, standardized defect escape rates. Publicly available data often reflects recalls, complaints, incidents, or regulatory actions rather than the full internal defect population. In organizations that rely heavily on statistical sampling, the measured defect rate may be less a complete picture than a partial signal.
100% inspection vs statistical sampling: what actually changes?
For practical purposes, quality systems can be viewed through two different operating models: environments that approach 100% inspection and environments that rely primarily on statistical sampling.
Statistical sampling is not inherently flawed. It has served industry for decades and remains appropriate in many contexts. The risk appears when sampling results are interpreted as if they represent certainty. A sample can indicate process behavior, but it does not guarantee that every defective unit has been detected.
The gap between measured complaints and actual dissatisfaction compounds the problem. Many dissatisfied customers never complain directly to the manufacturer. They may simply stop buying, switch suppliers, share the experience informally, or leave a negative impression on the market.
Why do complaint rates understate the real defect rate?
Complaint data is valuable, but it is rarely complete. A low complaint rate can create confidence, yet it may only capture a fraction of the actual customer experience. This is especially important in categories where defects are inconvenient but not severe enough to trigger formal escalation.
Consider a company that sees only a 0.1% complaint rate and concludes that 99.9% of its output is acceptable. If only a small share of dissatisfied customers report problems, that complaint rate may represent a much larger volume of actual defects in the market. The financial impact then extends beyond returns or warranty claims into repeat purchases, account retention, reputation, and market share.
The lesson is not that every complaint multiplier is universal. The lesson is that complaint data must be translated into business impact. Executives should ask: How many customers experienced the issue but did not tell us? What revenue is at risk? What repeat business may be lost? What brand perception are we unintentionally reinforcing?
How do you convert a defect escape rate into a cost?
Industries with life-critical consequences have learned to operate with extremely low tolerance for defects because the cost of one escape can be catastrophic. Other sectors may tolerate higher apparent defect rates because the immediate consequence seems smaller. That does not mean the economic damage is small. It may simply be less visible.
How does AI change the economics of inspection?
AI inspection changes the economics because it makes continuous inspection more practical. Instead of asking how often to inspect, leaders can begin asking what level of confidence they need, which defects matter most, and what quality standard they want the market to associate with their brand.
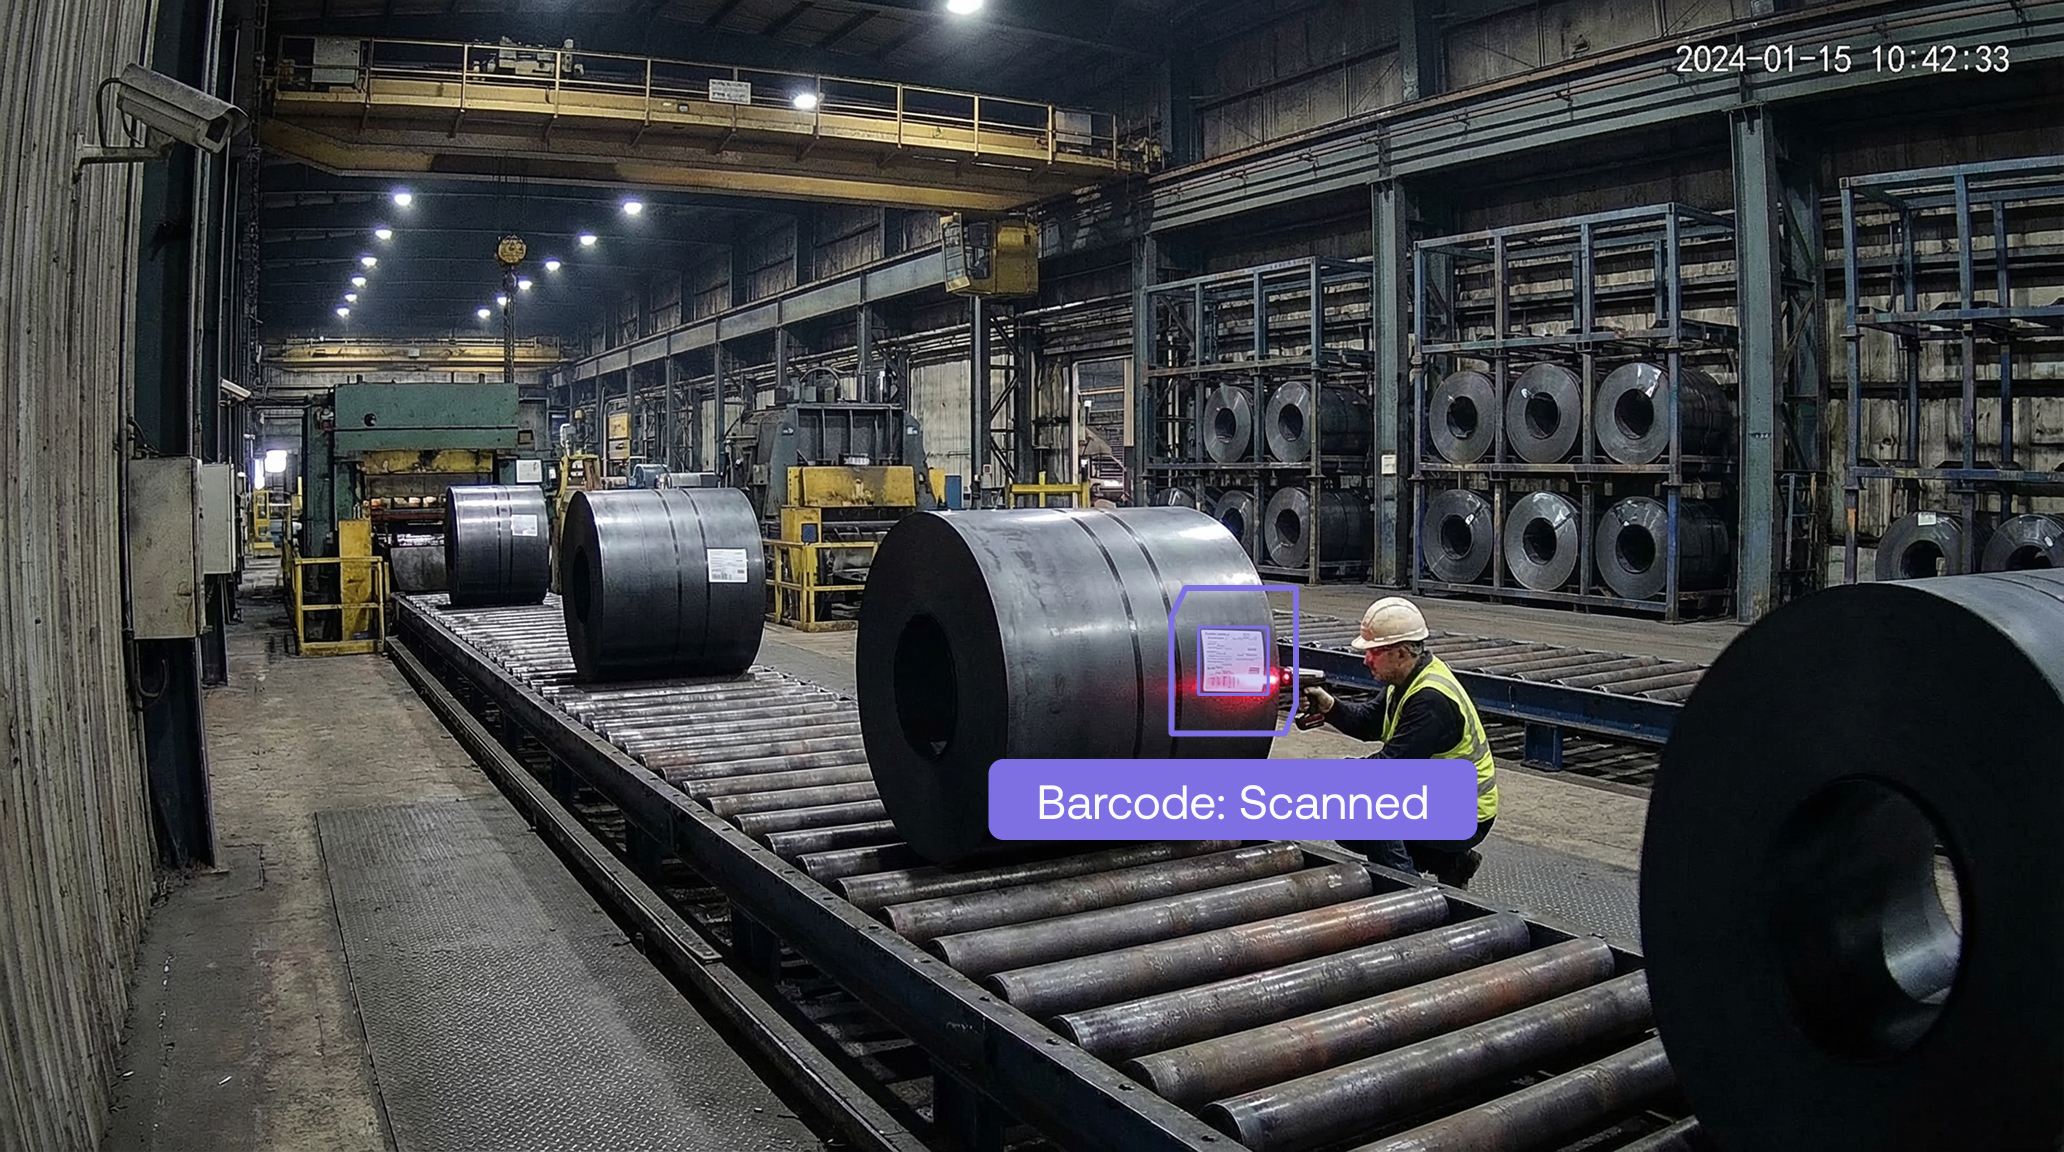
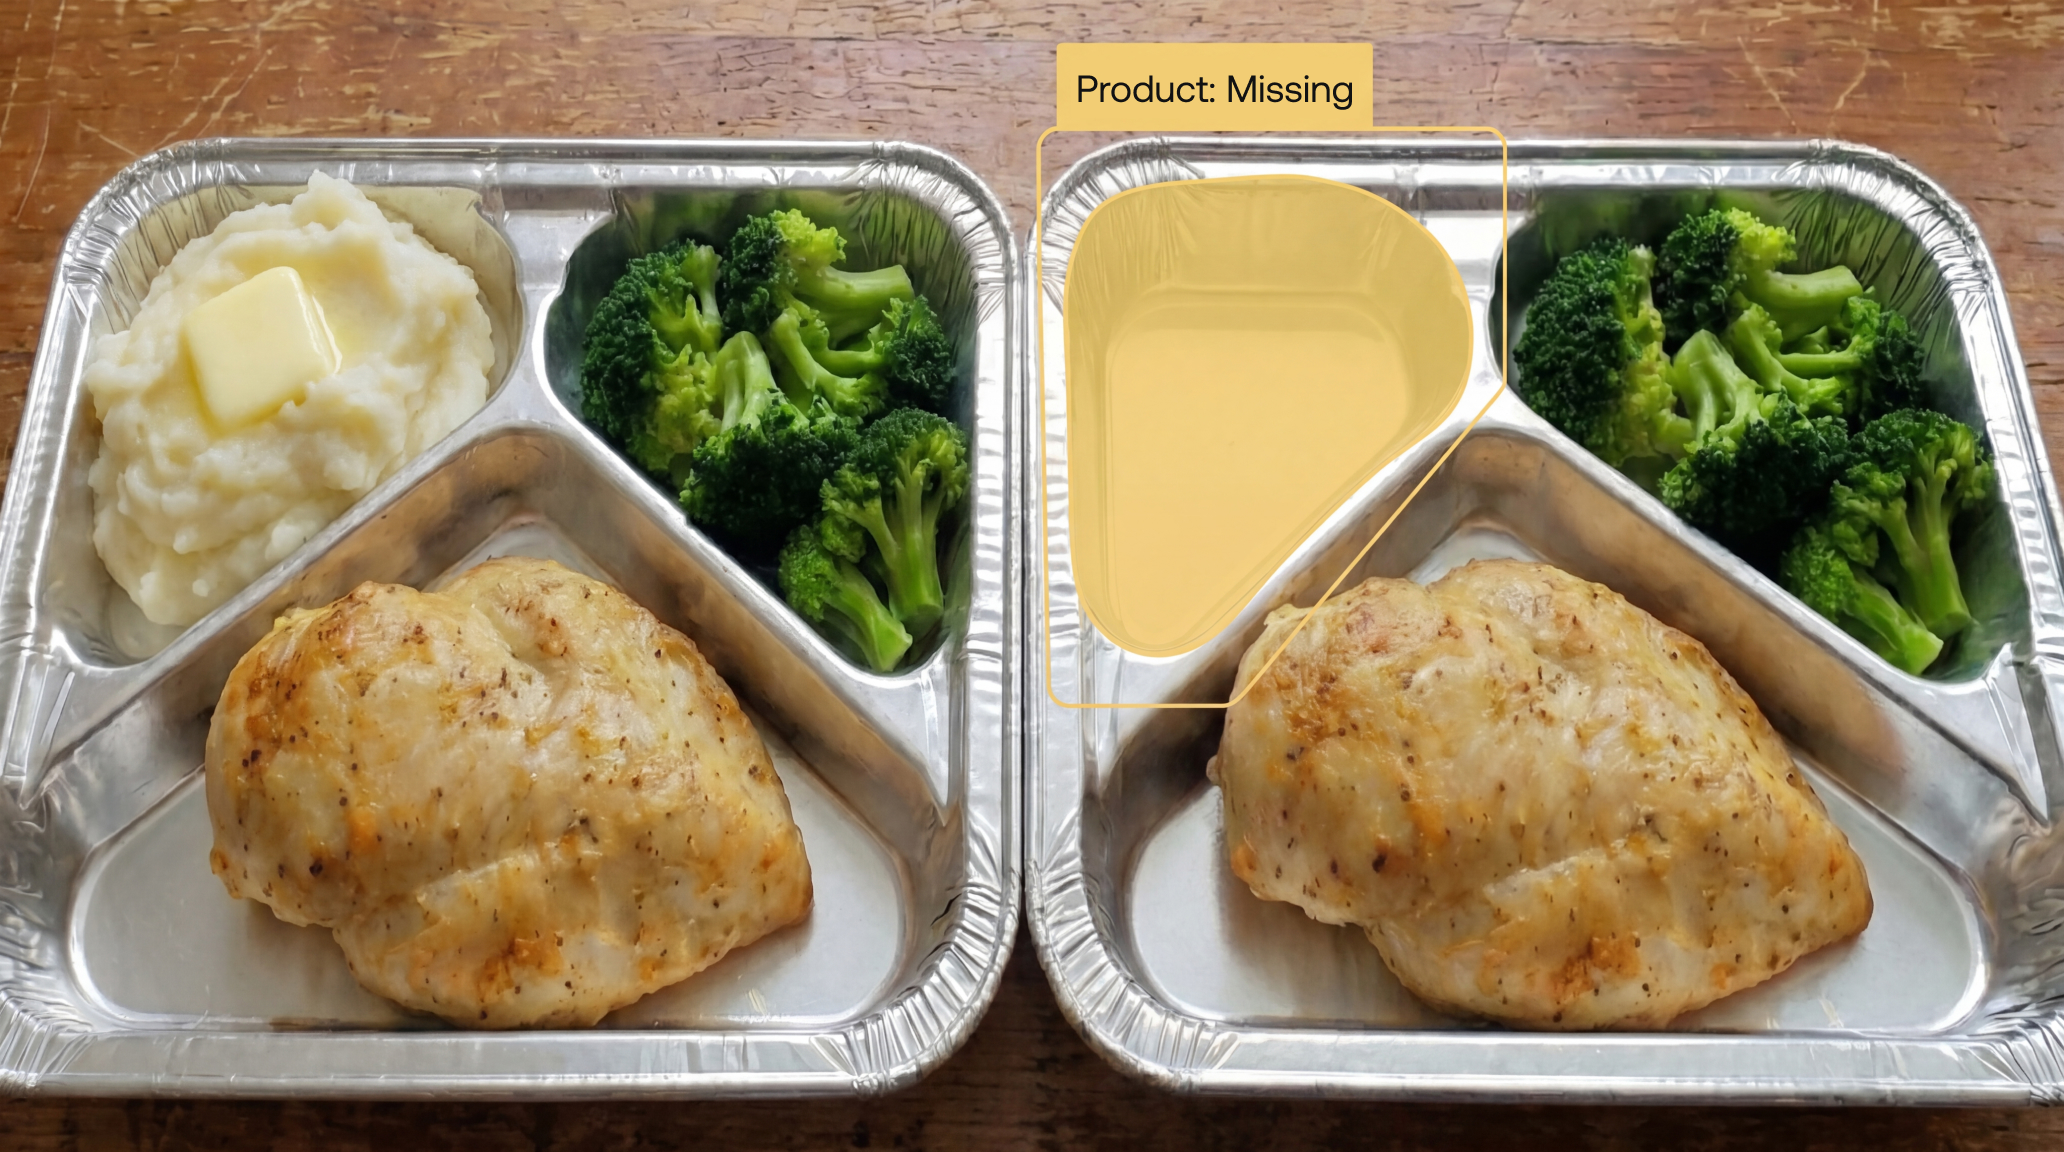
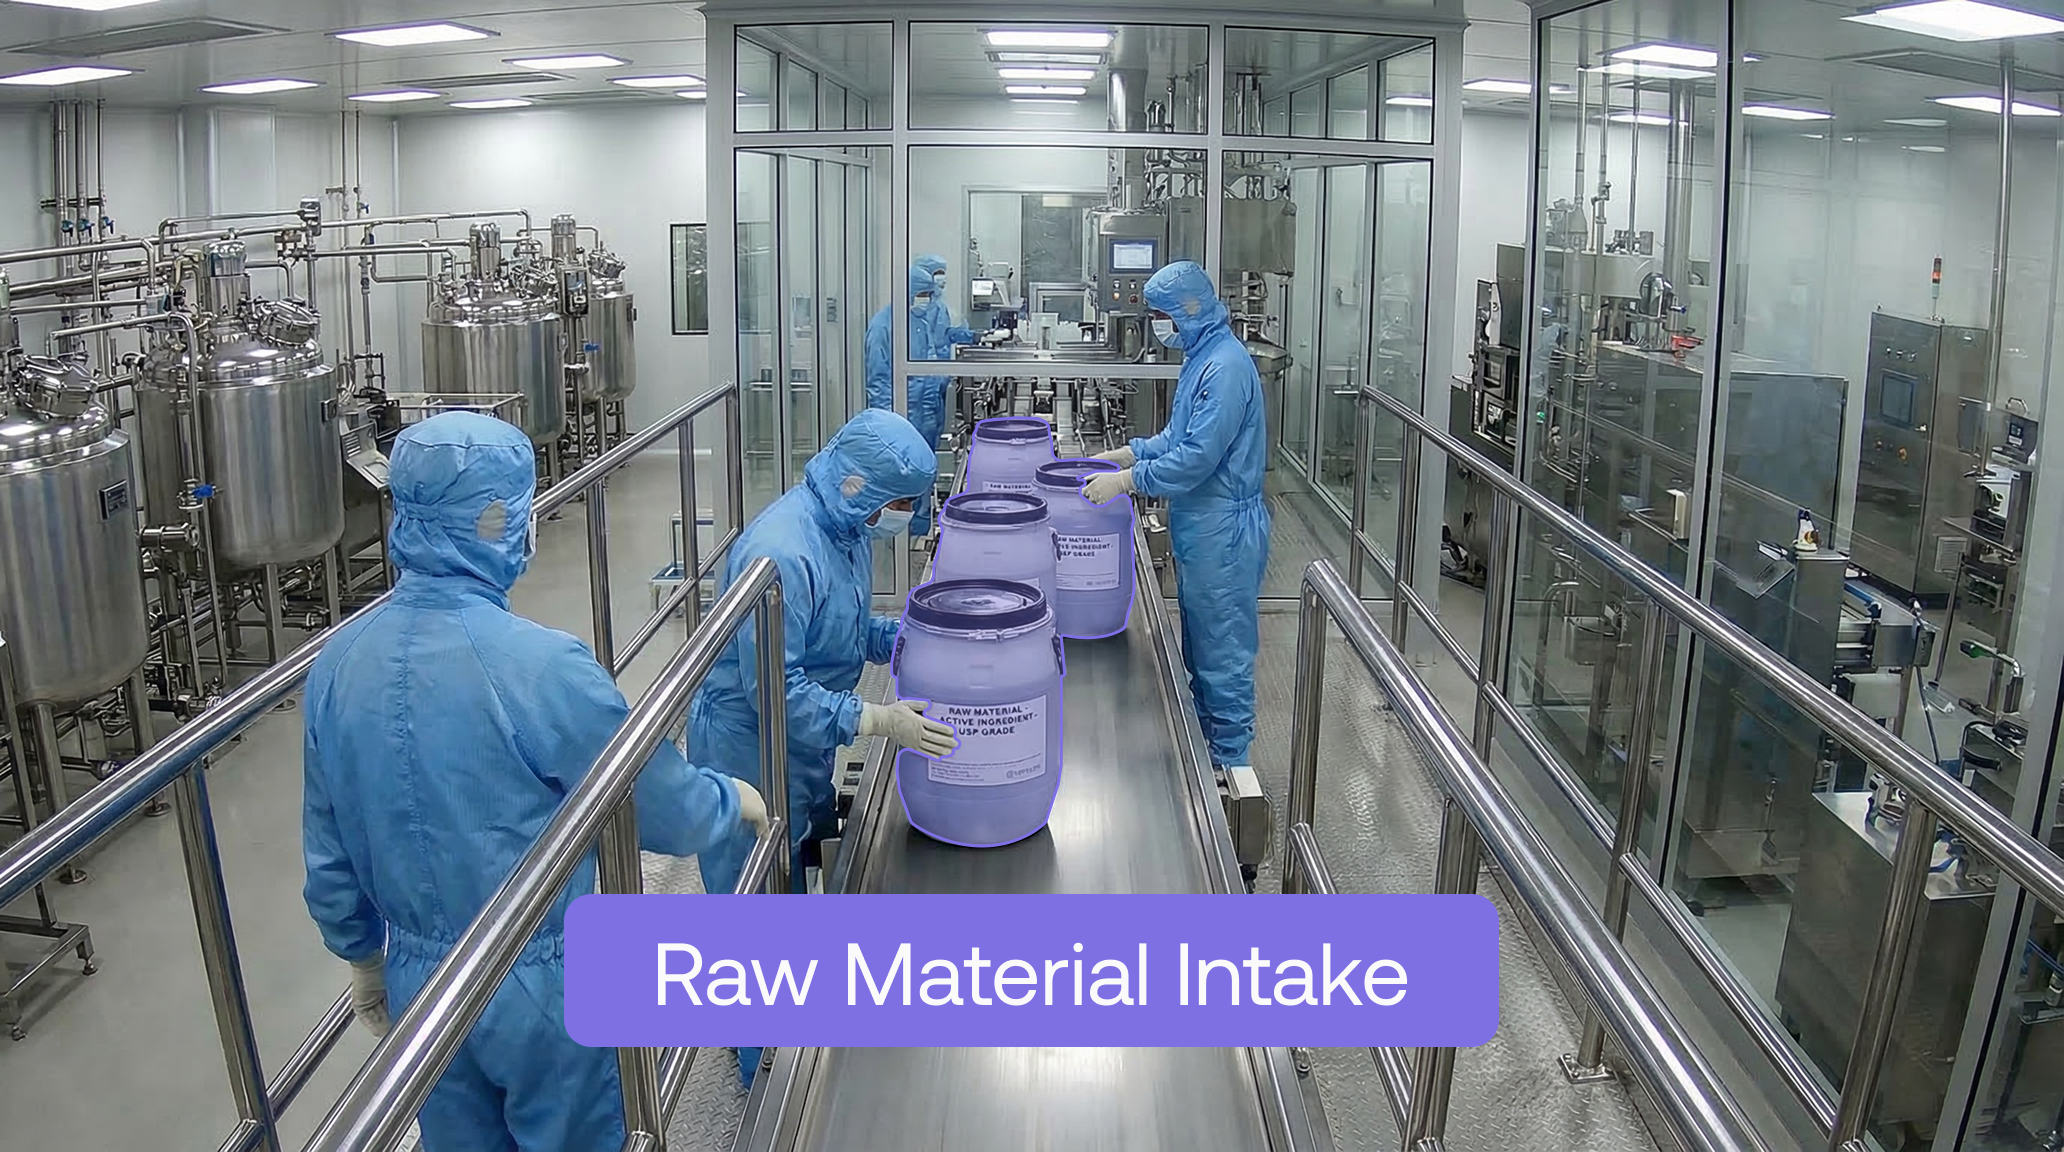
Systems such as Maneva VITA (Video-to-Action AI) agent illustrate this shift. When production can be observed continuously, quality control moves from periodic detection to ongoing visibility. The goal is not only to catch more defects; it is to reduce uncertainty, standardize decisions, and create a richer data foundation for operational improvement.
Does the traditional quality-cost curve still hold?
Most quality professionals know the traditional quality-cost curve. Failure costs decline as quality improves, while prevention and appraisal costs rise. At some point, the model suggests an economic optimum where total cost is minimized.
That model made sense when higher confidence required more inspectors, more sampling, more testing, and more manual effort. Under those conditions, pushing toward higher quality often increased appraisal cost significantly.
AI changes the shape of that curve. When inspection can be automated, consistent, and performed at production speed, the marginal cost of increasing inspection coverage can fall dramatically. The trade-off does not disappear: false positives, model confidence, retraining, and secondary review still matter. But the economics become materially different from a traditional inspection model. The trade-off can be further minimized by the use of high-accuracy AI models such as Maneva VITA.
How do quality escapes damage brand perception?
Quality is not only an internal metric. It is also part of the promise a brand makes to the market. When companies lack visibility into defect escapes, they allow customers to define perceived quality through inconsistent experiences, informal word of mouth, and competitive comparison.
What is the competitive advantage of continuous inspection?
Consider two competitors with similar processes, products, and cost structures. One relies on traditional sampling and manual inspection. The other uses Maneva AI-enabled inspection to observe production continuously, reduce defect escapes, and generate better quality intelligence. Over time, the second company is not simply inspecting better; it is learning faster. This is the operating-model advantage I described in How AI Scales Continuous Improvement, now viewed through the lens of quality economics.
The strategic question is therefore not whether AI inspection will become part of modern quality management. It will. The real question is who will use it first to redefine quality expectations, protect the brand, and convert operational visibility into market advantage. To see what continuous cost of poor quality visibility looks like on a live line, start at maneva.ai/solutions/quality-assurance.