
What Your OEE Score Is Not Telling You: The Hidden Data Gap AI Closes
I've spent most of my career inside manufacturing operations, coaching continuous improvement and operations excellence teams across regulated, high-mix plants, where a tenth of a point of efficiency was fought for daily. So, I'll admit something that took me years to accept: the OEE number we reported up the chain was often the least interesting thing about the line it described. It was tidy, it trended nicely on a slide, and it quietly buried the very problems we were being paid to find.
Now that I'm at Maneva, where we build OEE AI manufacturing systems that work alongside production teams, I see the same opportunity in plant after plant. The score isn't wrong, it's just incomplete in ways that matter. And the gap between what your OEE says and what is happening on your floor is precisely where the next decade of improvement lives.
The comfort of a single number
Overall Equipment Effectiveness is supposed to be the honest broker of the shop floor, the one figure combining availability, performance, and quality/yield. That elegance is also the trap. When you compress three different stories into a single percentage, you lose the plot of each one.
The benchmark data makes this concrete. Godlan's 2025 OEE Benchmark by Manufacturing Industry Vertical, drawn from more than 1,470 discrete manufacturing operations, found that the average plant runs at roughly 66.8% OEE. This performance spans a wide band by sector, from medical devices near 78% down to trailers and RVs around 57%. World-class OEE performance (85%+) is rare almost everywhere: about 23% of medical-device operations reach it, versus under 4% of trailer and RV makers.
Most leaders read those numbers and ask, "How do I move my single score up?" The better question is, "Which of the three components do I need to focus on and make sure that it is reported accurately?"
Where the benchmark quietly points
Look at the component breakdown and something jumps out. Across every sector Godlan studied, the quality factor stays remarkably high, consistently above 95%, and as high as 99.2% in aerospace and defense. Availability, by contrast, is the persistent drag, sitting in the high-60s to low-80s depending on the industry. The headline loss factors confirm it: unplanned downtime accounts for about 34% of total losses and setup/changeover another 29%, while logged quality issues represent only around 13%.
The standard interpretation is reasonable: chase downtime and changeover, because that's where the losses are. And you should. But sit with that 95%-plus quality figure for a moment, because it's doing more concealing than revealing.
A quality factor that high, in plants still wrestling with downtime and material shortages, usually doesn't mean defects aren't happening. It means defects aren't detected and recorded in the data that feeds OEE. Quality, in most OEE calculations, is a count of what got caught, typically at a sampling station, on an audit, at a final check. It is not a measure of what walked out the door. The number looks pristine because the measurement is coarse.
That's the hidden data gap. And it's not only in the quality factor.
Three places where your OEE data goes dark
- Manual and delayed capture. A meaningful share of plants still log/track downtime reasons by hand, after the fact, into a category list that was never designed for diagnosis. "Mechanical" or "changeover" absorbs a dozen distinct root causes. The score is calculated from data that a human summarized hours later, which means the most actionable detail disappears before it was ever recorded.
- Micro-stops that aggregate away. A line that pauses for eight seconds two hundred times a shift rarely shows up as downtime. It bleeds out of the performance factor as a vague "speed loss." OEE tells you the line ran slow; it almost never tells you it stuttered, or why.
- Sampling-based quality. This is the big one. If you inspect one part in fifty, your quality factor is an estimate dressed as a fact. Subtle, intermittent, or cosmetic defects are exactly the ones that generate warranty claims and customer turn, and are statistically likely to slip through the manufacturing process. The plant reports 97% quality and genuinely believes it.
None of these gaps are failures of effort. They're failures of resolution and visibility. You cannot improve what your instrumentation cannot see, and traditional OEE instrumentation sees the floor through a low-resolution lens.
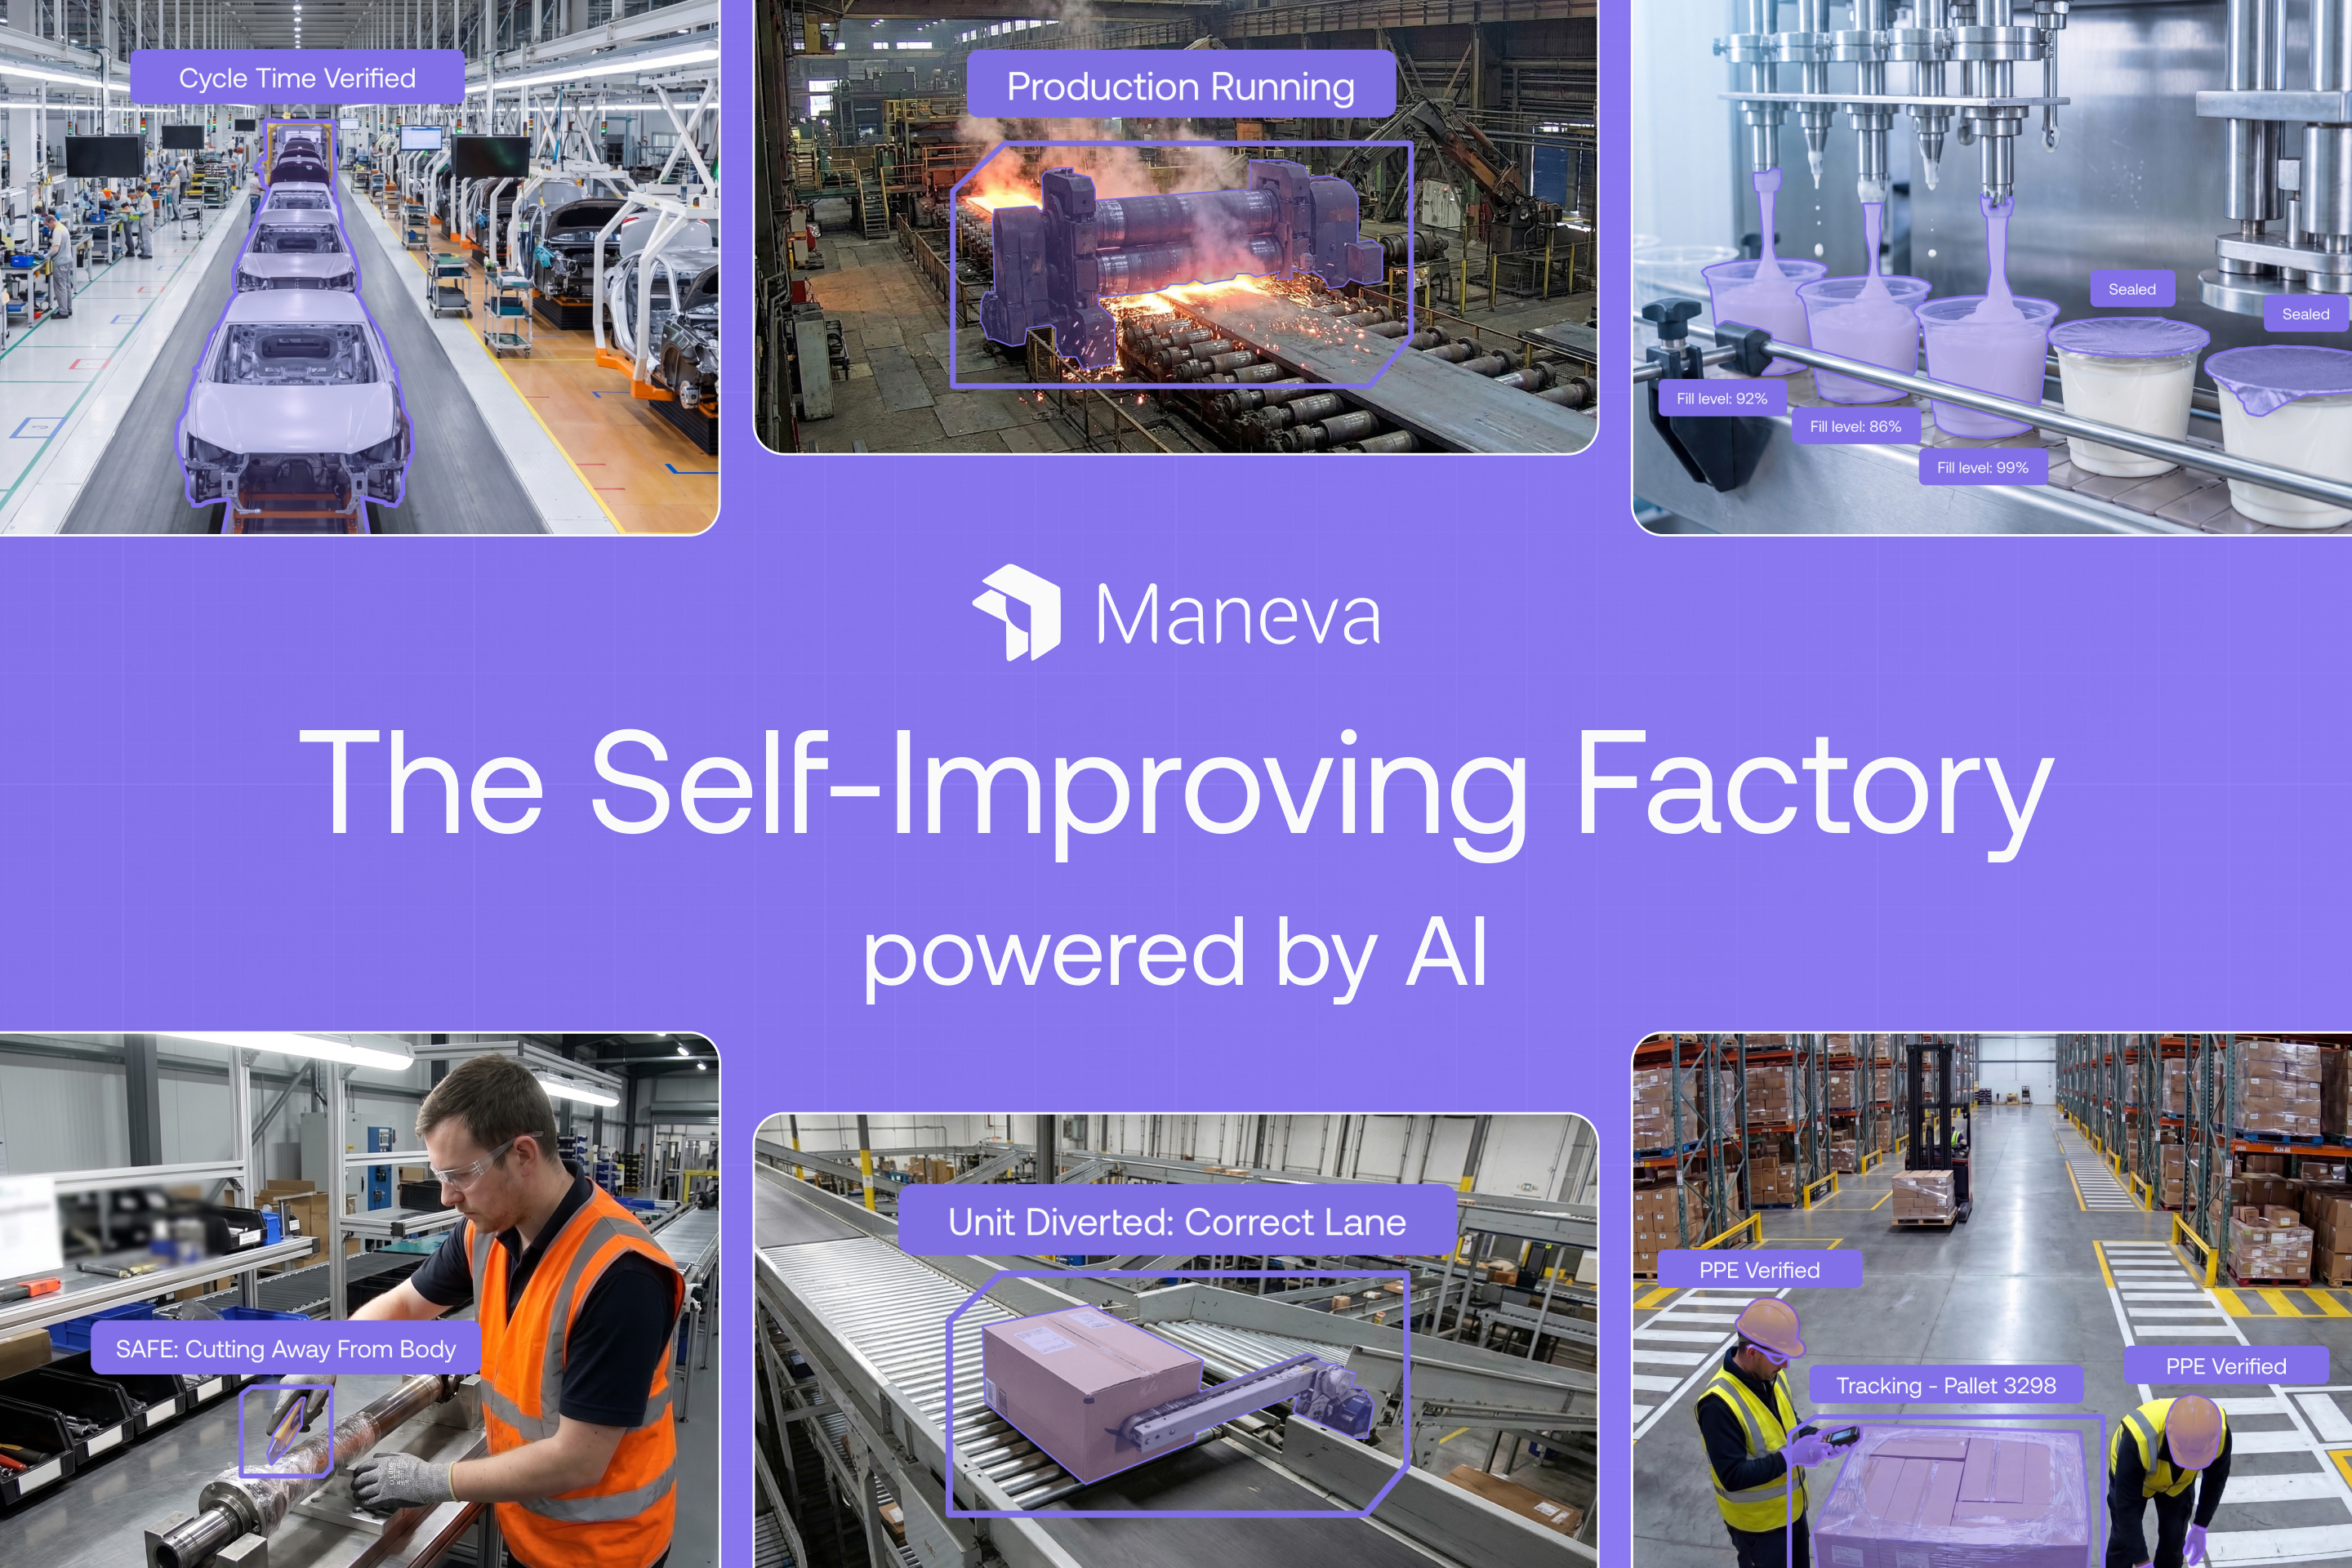
What OEE AI Manufacturing Closes
This is where the conversation around OEE AI manufacturing stops being a buzzword and starts being a measurement upgrade. The value of AI here isn't a smarter dashboard, it's a denser, continuous, automatically captured record of reality.
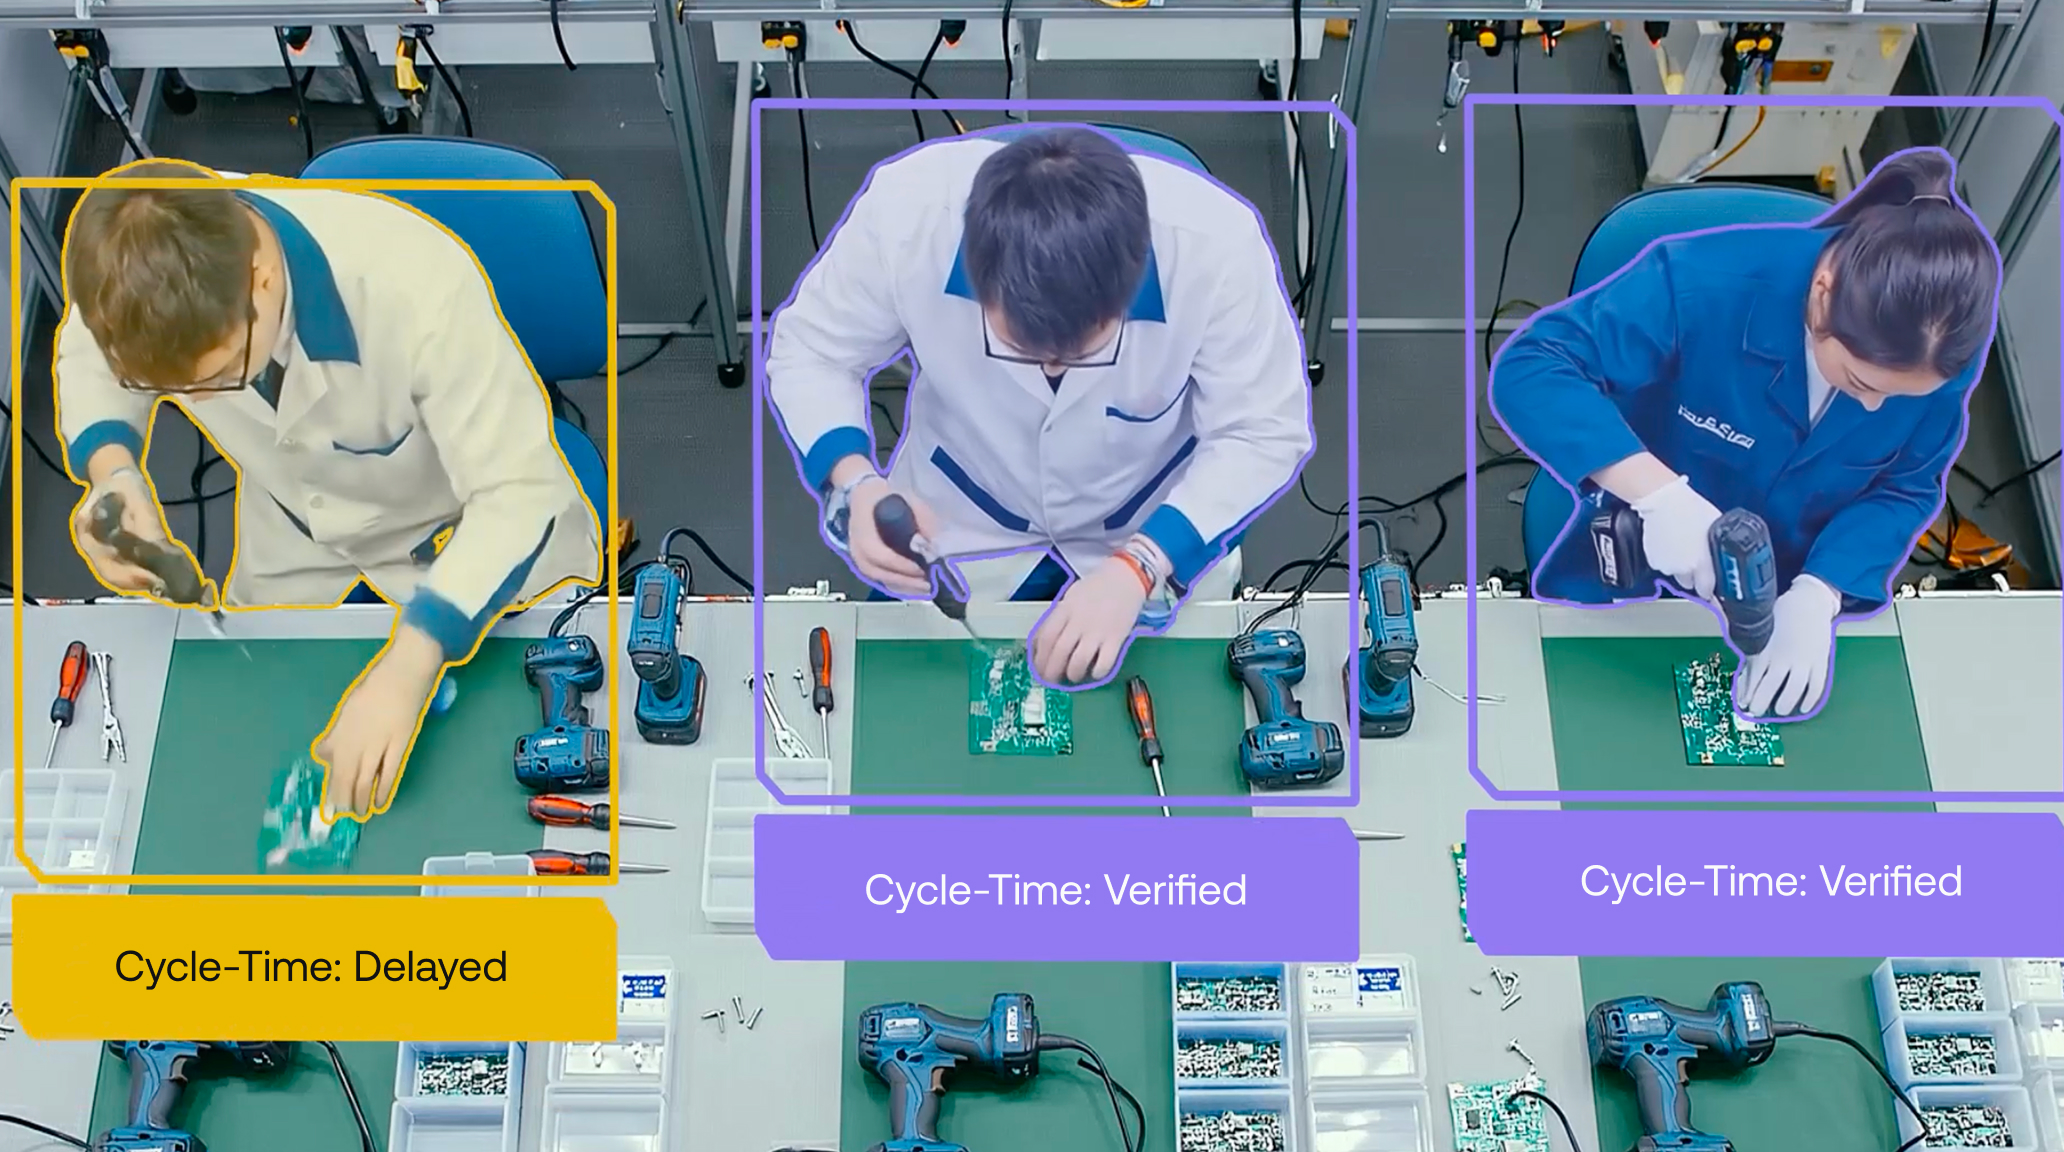
Maneva's VITA (Video-to-Action AI) agent runs continuous AI monitoring on existing factory cameras. It doesn't sample, it observes continuously. It timestamps every micro-stop instead of rounding it into "speed loss." It classifies downtime causes the moment they occur, with far more granularity than a manual code list, so the 34% downtime figure stops being a wall and starts being a sorted list of fixable causes. In practice, OEE AI manufacturing tools turn the same three factors you already track into evidence you can act on because the underlying data finally matches what an operator standing at the line would tell you if you asked.
The point isn't to replace OEE. It's to feed it honest inputs through AI-driven productivity efficiency. A 66.8% score built on continuous, machine-captured data is worth ten times a 78% score built on hourly hand entries, because the first one tells you exactly where you stand the next day and have prepared plans in hand ready to address opportunities.
The quality factor is the clearest case
If there's one component where the gap is widest, it's quality, which makes AI quality control manufacturing the most immediately convincing application. Moving from sampling to continuous, automated inspection means the flattering 95%-plus quality number is the first thing to change, usually downward, and that's a good thing. You're not getting worse. You're finally seeing what was always there.
Continuous machine vision defect detection catches the intermittent defect that the once-an-hour audit missed. It flags the drift before it becomes scrap. And critically, AI quality control manufacturing systems feed that detection straight back into the OEE calculation, so the quality factor reflects defects produced rather than defects sampled. The first time a plant runs this, the conversation in the morning meeting changes completely because the team is now arguing about real escapes instead of trusting a number that was never measuring escapes in the first place.
There's a strategic payoff too. Godlan's data shows quality is the one factor already near its ceiling on paper across every sector. That means it's the factor most likely to be hiding its true variance. Closing that measurement gap is where many plants will find the improvement everyone assumed had already been captured.
From scorekeeping to seeing
Here's the reframe I'd offer any operations leader still treating OEE as the finish line. Your score was designed for an era when capturing plant data was expensive, so we sampled, summarized, and rolled it up into one number we could manage by. That constraint is gone. Continuous capture is now affordable and increasingly automatic using sensors and PLC data.
The make-to-order plants in the benchmark, the marine, specialty vehicle, and aerospace shops sitting 15 to 20% below their standardized peers, are not less capable. They're less visible. Their complexity generates exactly the kind of micro losses and intermittent defects that traditional OEE measurement is worst at seeing. McKinsey's 2025 survey of manufacturing COOs confirms that the plants pulling ahead are the ones connecting AI to the floor itself, not to back-office dashboards. They have the most to gain from closing the data gap, and the least to gain from polishing the score.
So before you set next quarter's OEE target, ask the harder question: how much of your current score do you trust, and how much of it is an outcome of how you measure? The plants that win the next decade won't be the ones with the highest number. They'll be the ones who closed the gap between the number and the truth and then went to work on what they could finally see. Book a demo at maneva.ai to see what continuous OEE AI manufacturing actually looks like on your floor.