
AI or Not AI: Defect Is the Question
Executive Summary
Quality inspection is often treated as a sampling problem: how many units should be checked to create enough confidence that defects will be caught? In practice, many businesses still rely on fixed percentage sampling or customer-agreed sample sizes, even when those methods provide limited statistical protection. The result is a quality system that may look disciplined on paper but still allows significant risk to pass through the process.
This document explains why sampling alone can be misleading. Whether the objective is controlling giveaway, estimating average product weight, or detecting defects, every partial inspection strategy depends on probability. Small samples can create a false sense of confidence, and even statistically valid samples may still miss defects, underestimate variation, or fail to expose measurement system errors.
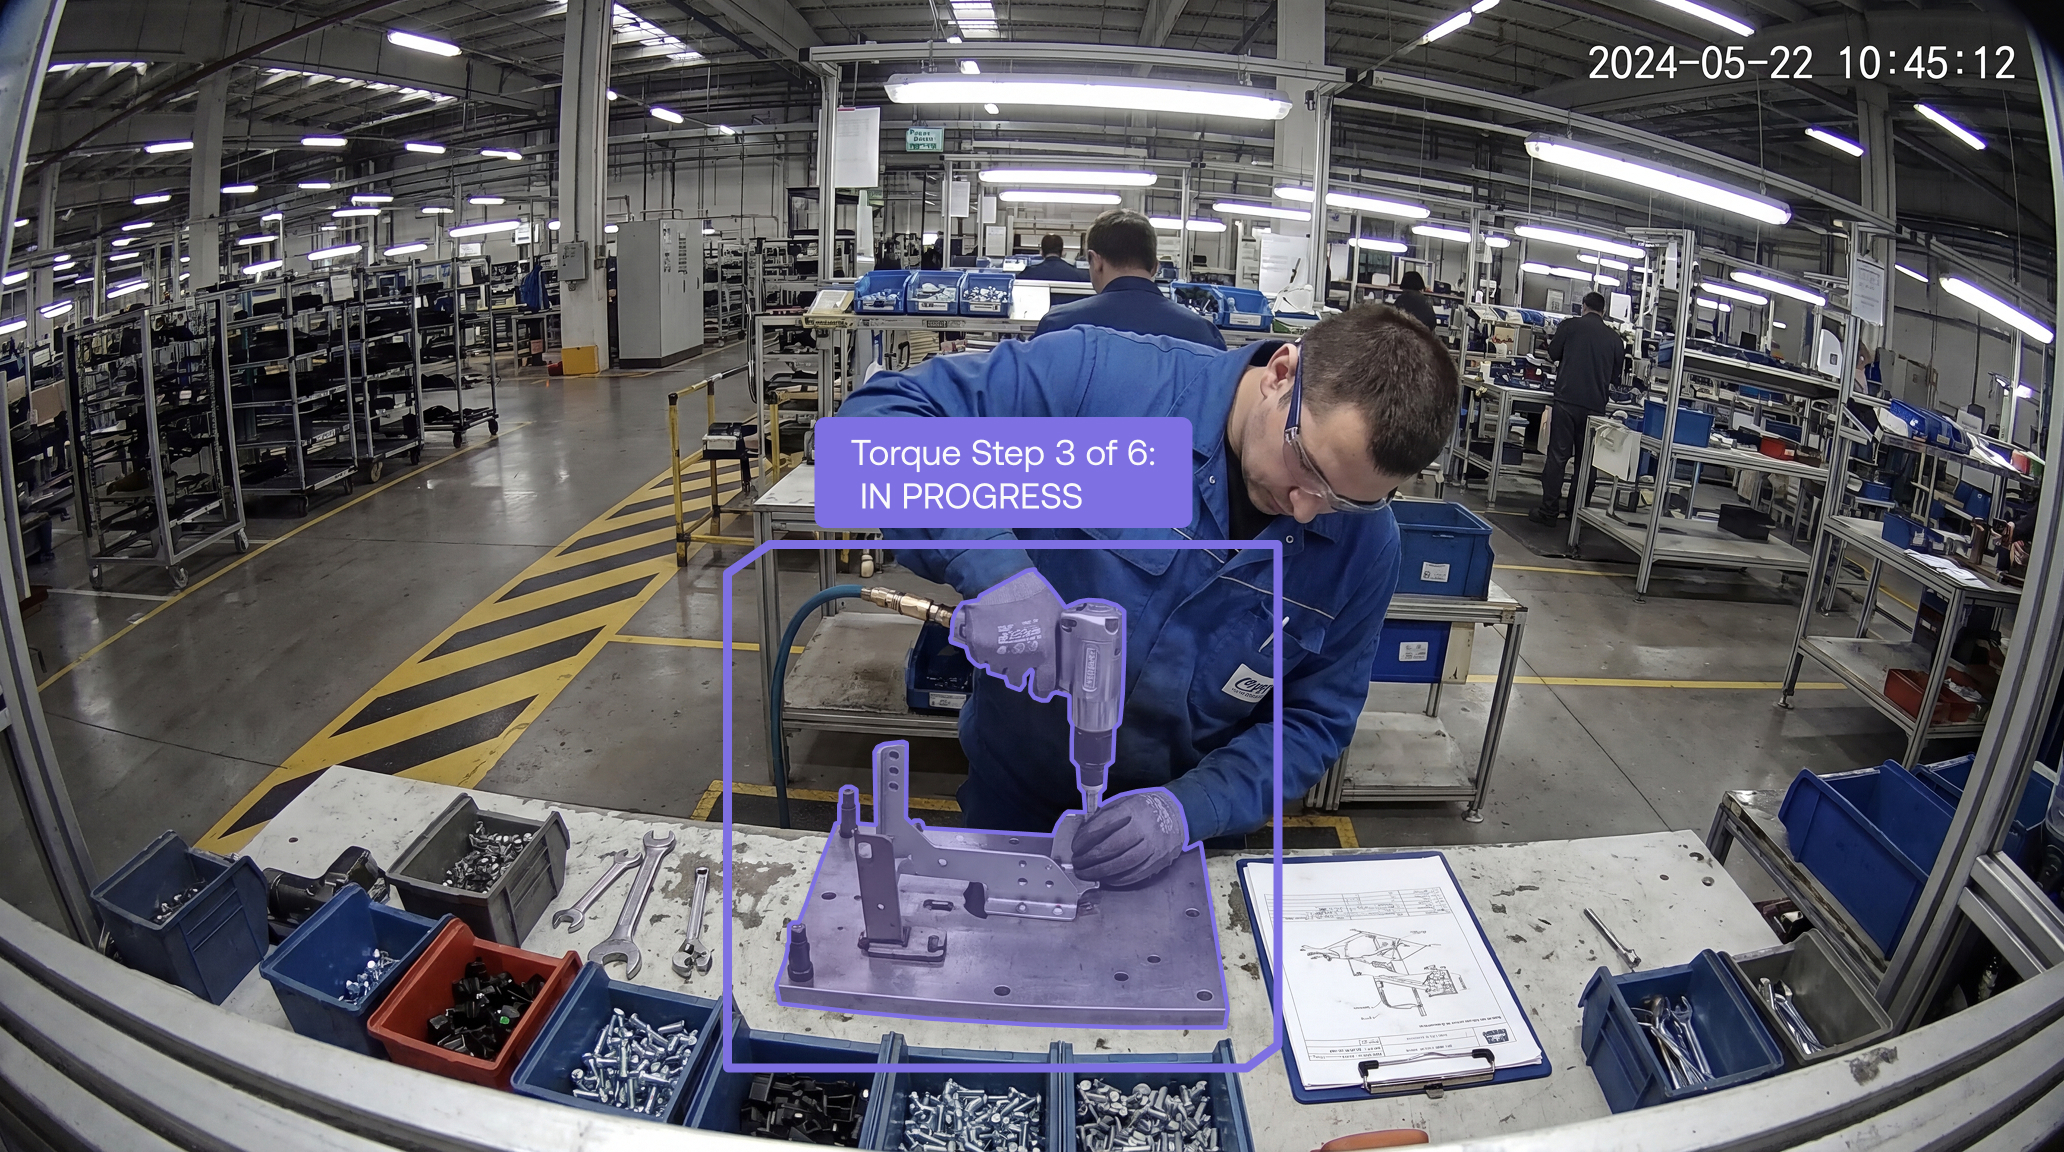
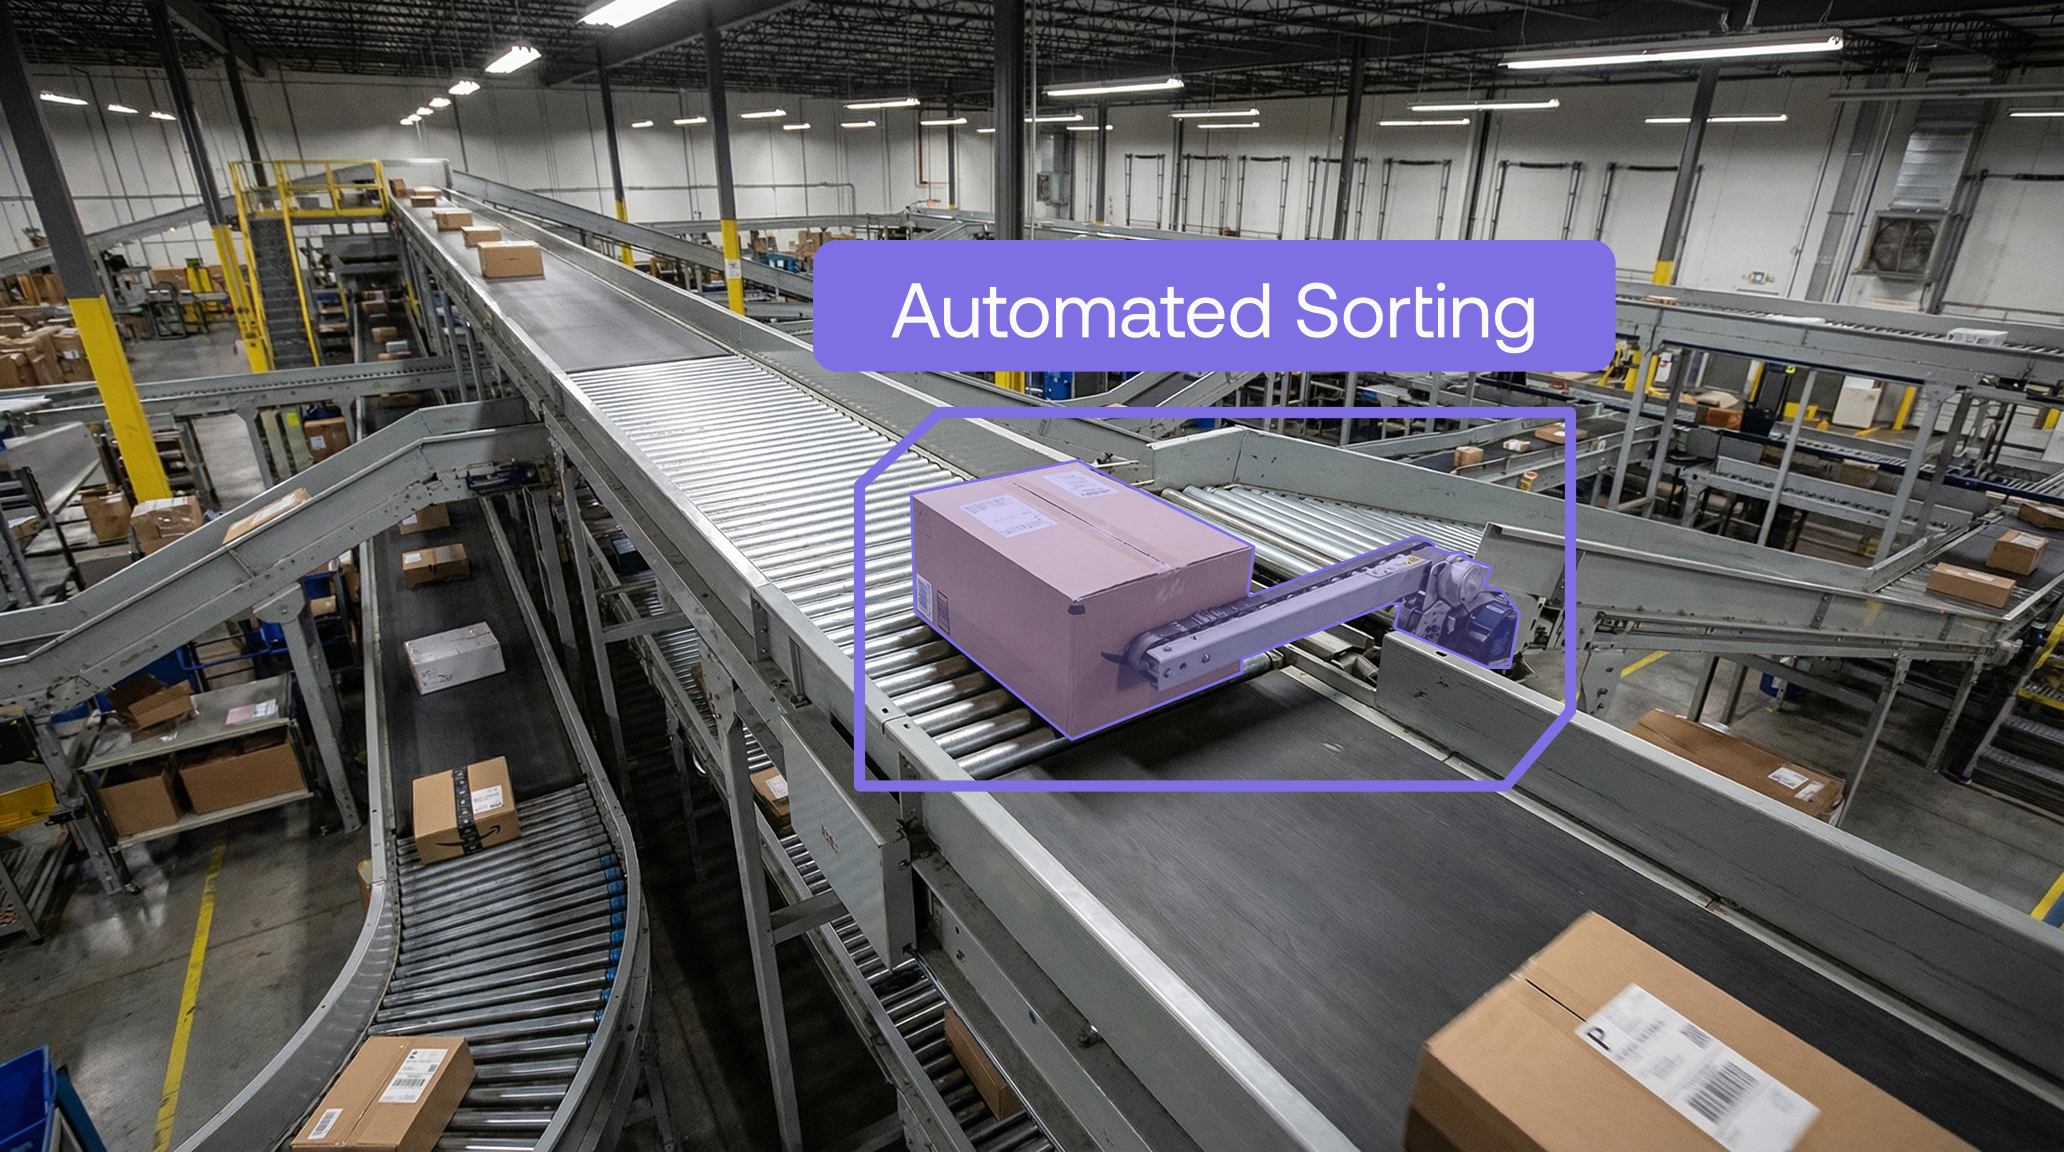
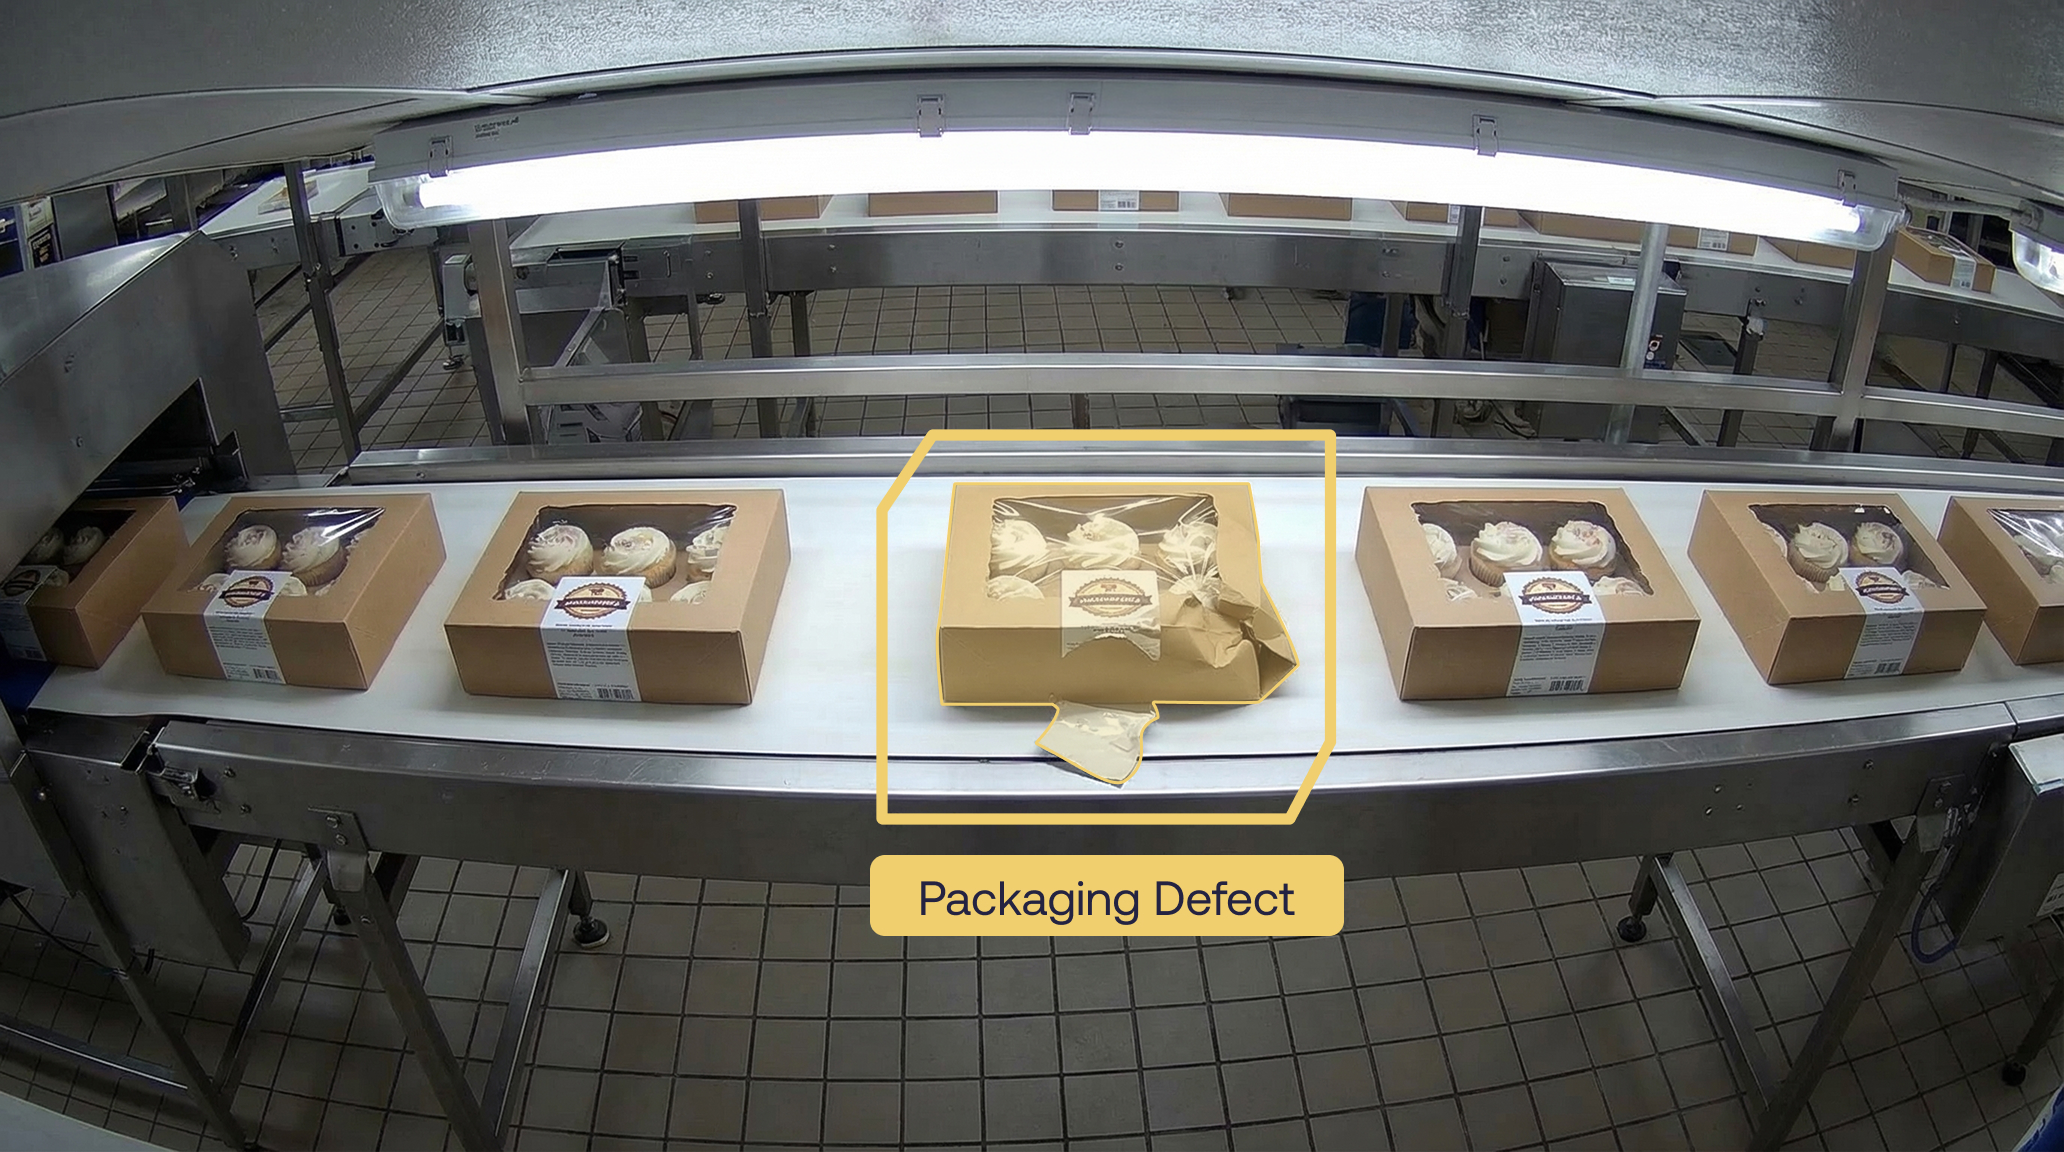
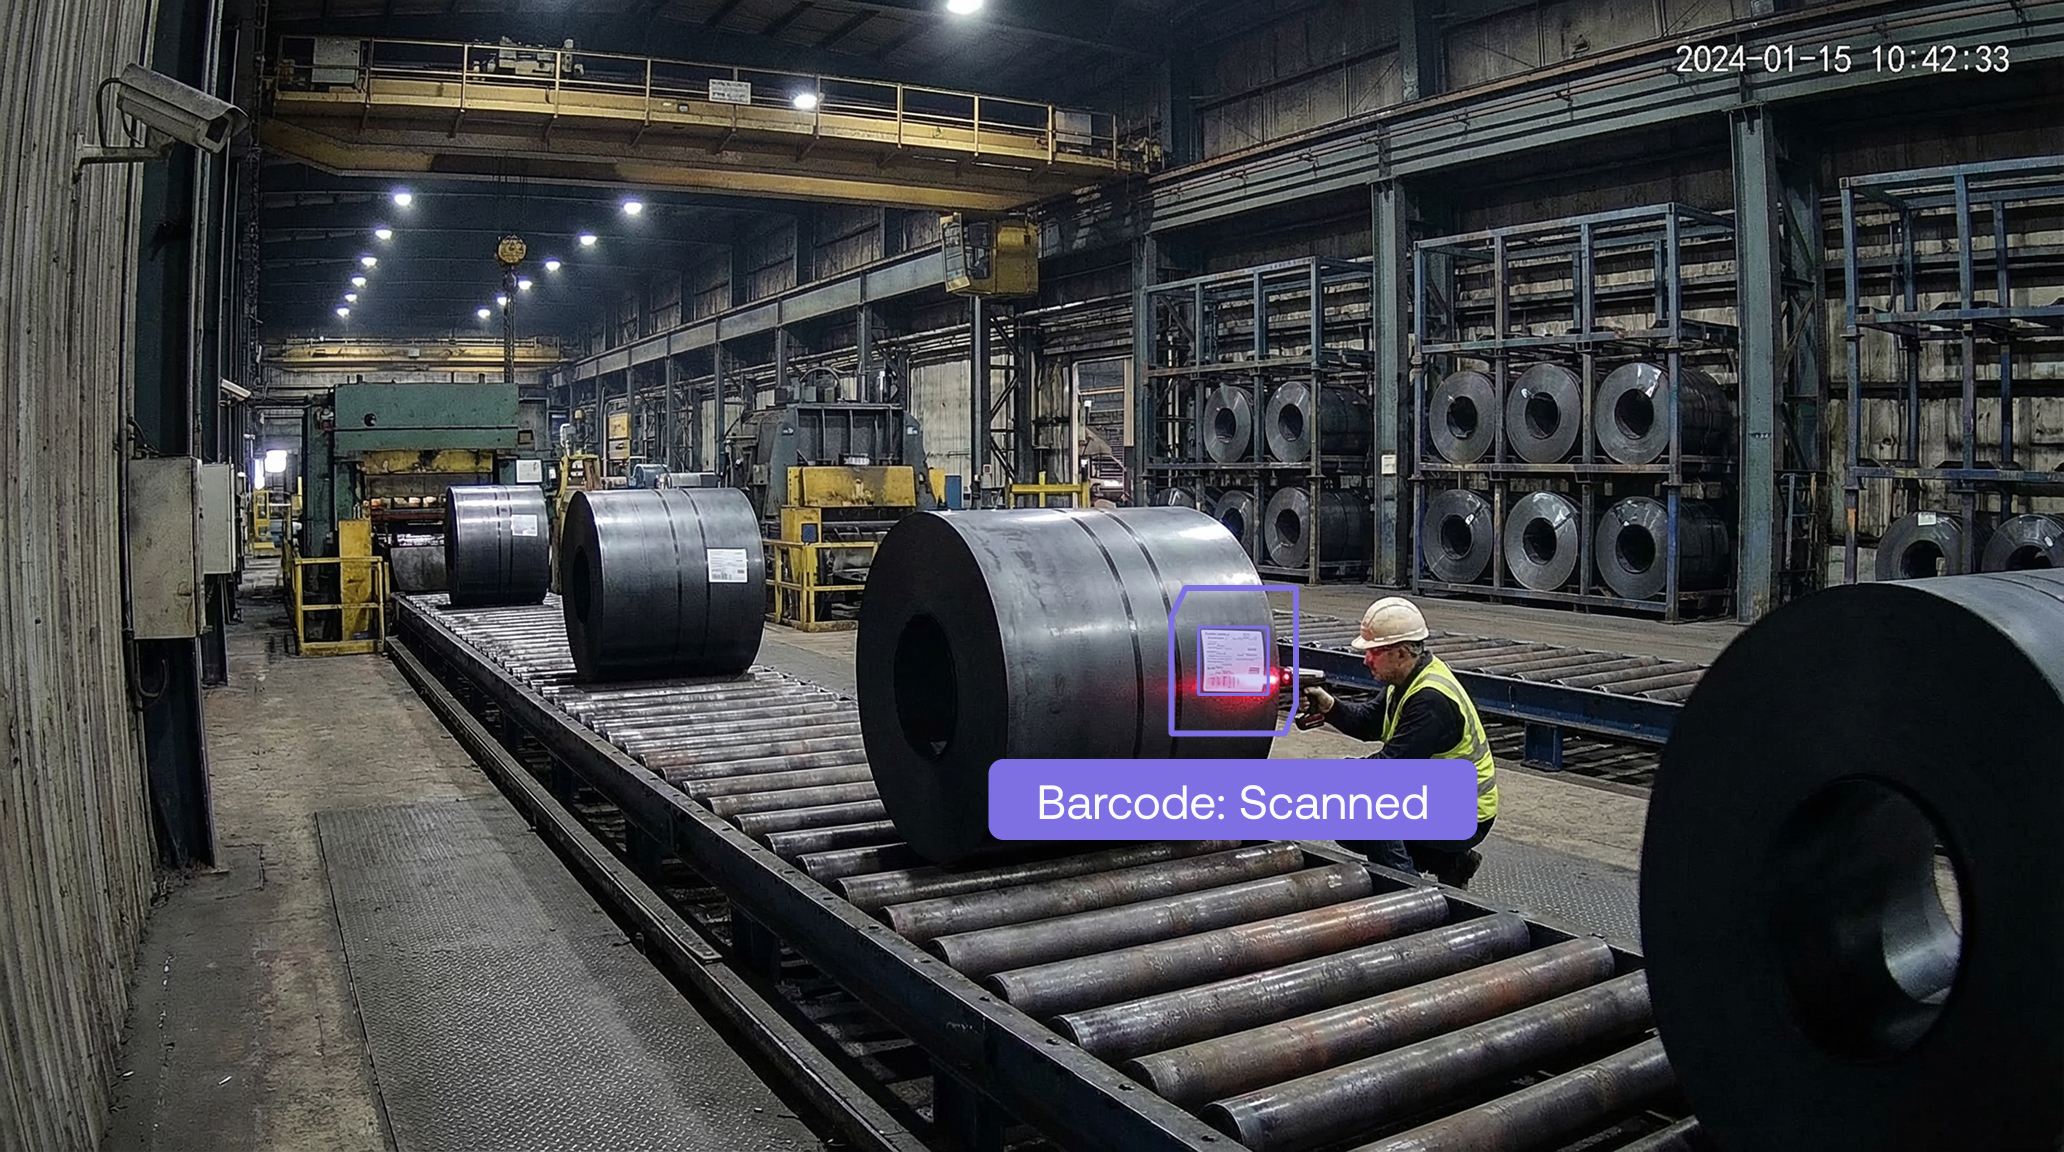
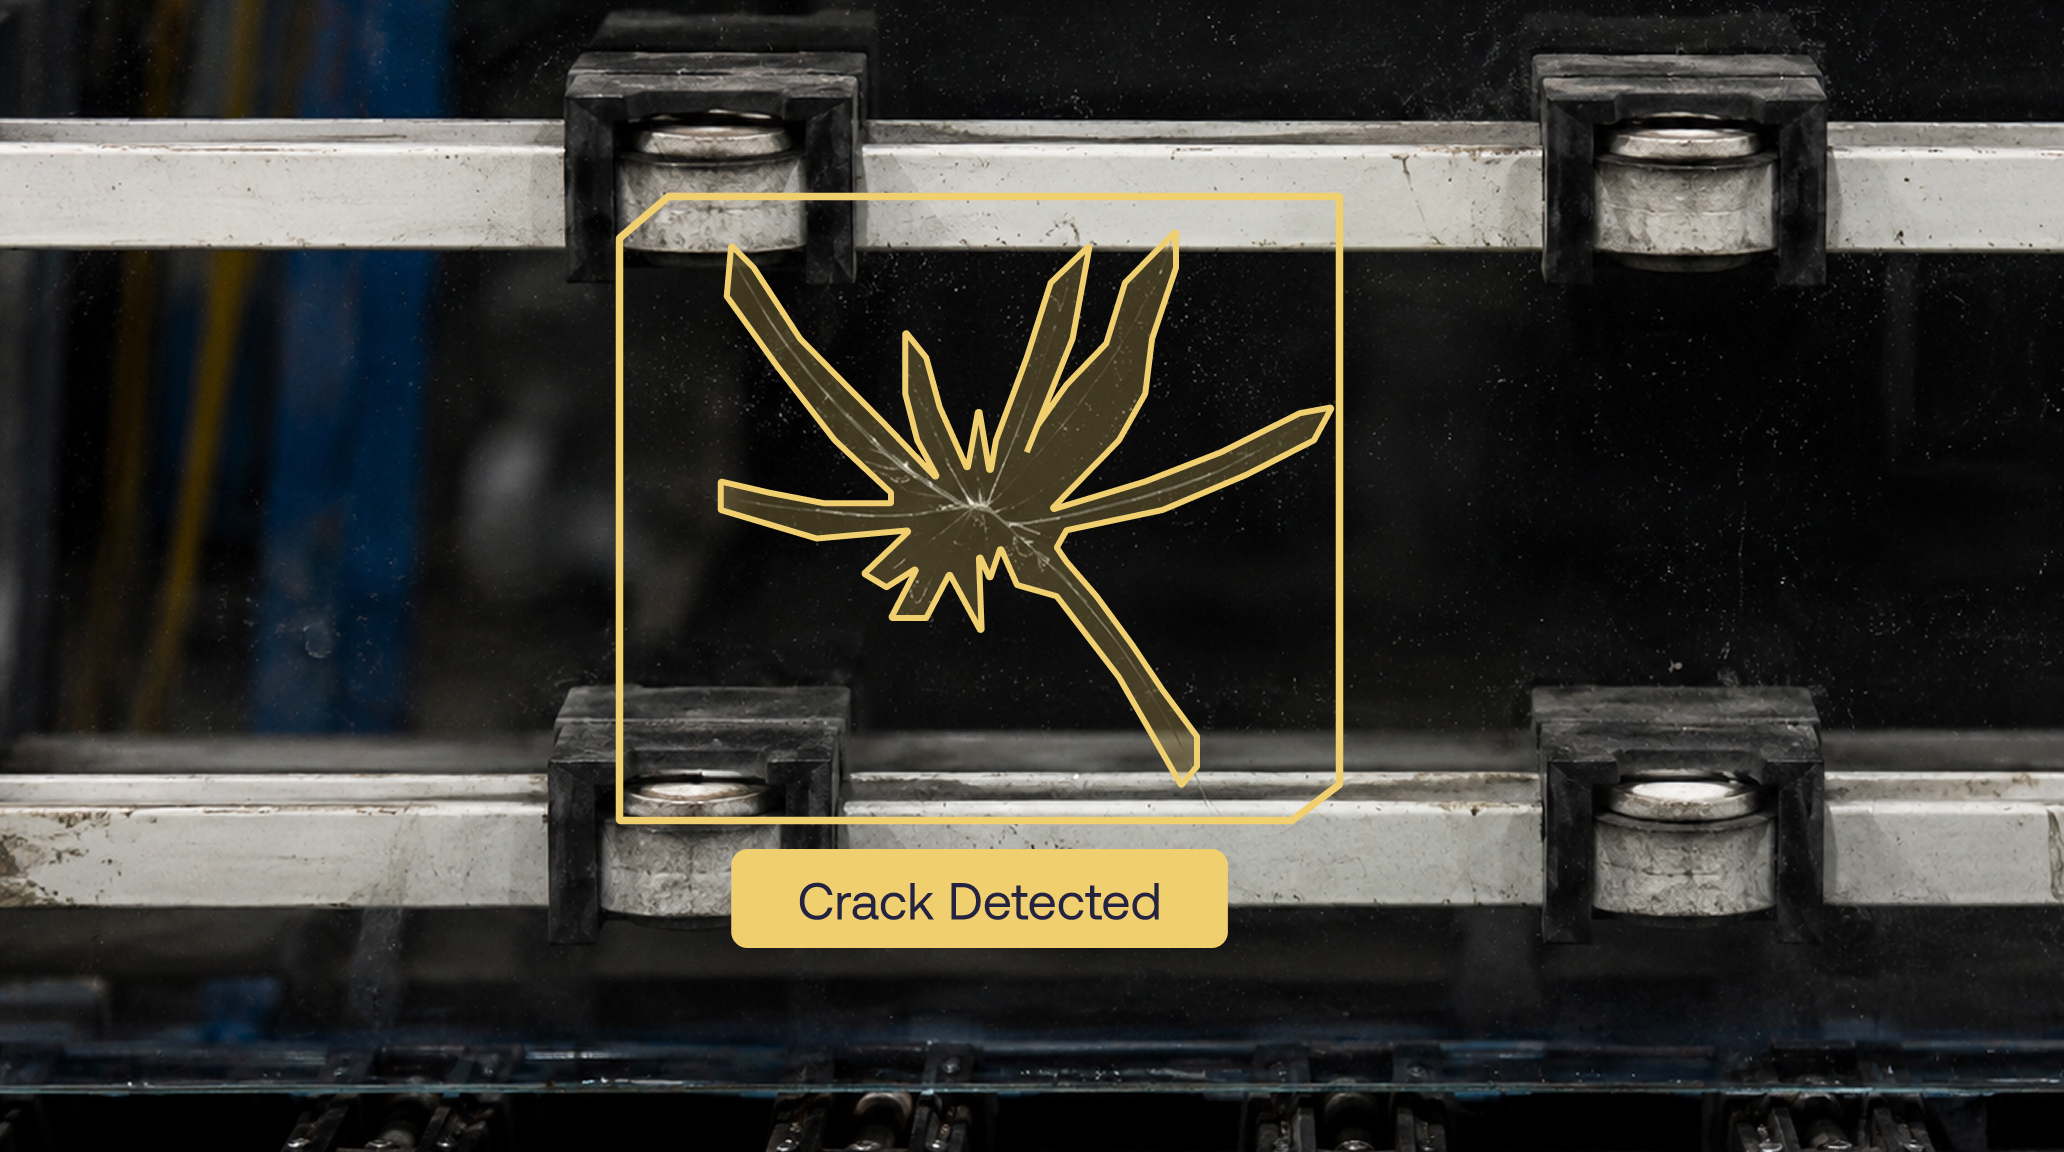
AI changes the economics and the logic of inspection. Instead of asking how many products need to be sampled, Maneva VITA (Video-to-Action AI) agent enables 100% observation and shifts the decision toward how strict the model should be. That allows customers to make deliberate tradeoffs between missed defects and false alarms based on operational cost, compliance risk, customer impact, and brand protection.
The central message is simple: traditional sampling can produce attractive quality numbers while missing the real defects that matter. By observing every product with consistent decision logic, AI quality inspection moves from probability-based detection to configurable risk management. The question is no longer whether AI belongs in quality inspection; it is how much risk the business is willing to keep accepting without it.
Sampling Strategies and Their Limits
Sample size strategy in quality inspection generally comes down to balancing inspection cost against the risk of allowing defects to pass through. The right approach depends on the type of quality check being performed. Below are the main strategies used in practice.
Fixed percentage sampling means checking a set proportion of each batch, such as 10% of every lot. It is simple to explain and administer, but it is statistically weak because the absolute number of defects detected does not scale appropriately with lot size. A 10% sample of 10,000 units behaves very differently from a 10% sample of 50 units. Most modern quality frameworks have moved away from this method for that reason, although many businesses still use it.
Statistical sampling plans such as ANSI/ASQ Z1.4 or ISO 2859, which are based on the military standard MIL-STD-105, are the industry-standard alternative. You select an Acceptable Quality Limit, which is the maximum defect rate you are willing to tolerate, and the standard tables provide the sample size and the acceptance/rejection numbers based on lot size and the desired inspection rigor: normal, tightened, or reduced. This is the approach most manufacturing and incoming goods inspection programs use.
Statistically calculated sample size based on confidence and margin of error is used when you want to estimate a defect rate or pass rate with a known level of precision; for example, "95% confidence that the true defect rate is within ±3%." You calculate the sample size from the desired confidence level, margin of error, and an estimate of the population variance or expected defect rate, using a conservative 50% when unknown. This is common in audits, survey-based QA, and process capability studies.
Risk-based or stratified sampling allocates more inspection effort to higher-risk areas, such as new suppliers, complex products, or process steps with a history of failures, and less effort to stable, low-risk areas. Sample sizes are not uniform; they are weighted by risk, which is more efficient than blanket coverage when inspection capacity is limited.
Sequential or adaptive sampling starts with a small sample and adds more samples only when results are ambiguous, stopping early when quality is clearly acceptable or clearly unacceptable. This minimizes inspection effort on average while still controlling decision risk, and it is common in continuous monitoring or SPC (statistical process control) contexts.
100% inspection is used when the cost of a defect is very high, such as in safety-critical components or regulated industries, and sampling risk is not acceptable. It is not truly a sample size strategy; it is the decision to bypass sampling altogether.
Why Sampling Can Create False Confidence
Most businesses know little about formal sample size strategies and default to fixed percentage sampling. Often, the number is simply chosen by agreement with the customer, with limited statistical justification.
However, this approach does not ensure reliable outcomes. Apart from 100% inspection, all sampling strategies rely on probability to identify defects, trends, or recurring patterns. Sampling too little increases the risk of missing quality issues, while sampling too much can drive unnecessary inspection cost and inefficiency.
Example: Giveaway and Average Weight
If I want to know how much product I am giving away, and I am not weighing 100% of my products, I need to know the average weight of those products. However, that average weight includes error from my sample size: CI = x̄ ± z × (σ/√n), where CI is the confidence interval, x̄ is the measured average, z is the confidence level expressed in sigma (for example, 1.96 for 95%, 2.576 for 99%, and 1.645 for 90%), σ is the standard deviation, and n is the sample size.
Therefore, if I want to deliver 16 oz bags, I measure only one bag that has 16 oz, and my standard deviation is 1 oz, I can be 95% confident that the average is somewhere between 14 oz and 18 oz, and 99% confident that it is somewhere between 13.4 oz and 18.6 oz. Because this is a square-root-of-n function, we must multiply the sample size by four to cut the confidence interval in half.
Completing a 10-sample weight check does not mean the average can be trusted without qualification; it still includes measurement error and process variability. It is common for an 8 oz bag of chips to have a standard deviation of 5%. With a sample size of 10, the average weight still carries an error of 1.96 × 5% / √10 = 3.1% above or below. And remember: if you are dealing with 2 oz bags, σ may double. As a result, you may be collecting perfectly valid numbers and still giving away 5% of your product or exposing yourself to nonconformity risk.
Example: Detecting Defects in a Continuous Process
The same logic applies when looking for defects: n = ln(1 − CI) / ln(1 − p), where n is the sample size to inspect, p is the real probability of a defect, and CI is the confidence level you want to achieve. For example, if my process is 99% good, meaning there is a 1% probability of generating a defect, and I want to be 99% confident that I will catch one defect, then n = ln(1 − 0.99) / ln(1 − 0.01) = 459 units must be inspected. This follows the logic that we are trying to catch one defect, not all of them.
Notice how much worse this becomes when only a single unit is pulled. If you have a continuous process that is 99% good and you pull one unit, you have only a 1% probability of catching a defect. If your line produces 60 bags per minute, you know from historical data that it is 99% good, and you check one bag every 30 minutes, then by the end of an eight-hour shift you have checked 16 bags. Your probability of catching a defect is 1 − 0.99^16 = 14%, while you have produced 60 bags × 480 minutes × 1% defect rate = 288 defective bags that may reach your customer.
When SPC Helps, and When It Does Not
If your measured characteristic is continuous, such as weight or length, and your process is well controlled, you can improve your quality system using SPC (Statistical Process Control).
SPC enables decisions based on process behavior rather than isolated observations. As a result, you are less exposed to random statistical variation. Still, you need strong Cpk performance and people who can react quickly when the process signals a problem. If you are detecting discrete defects, such as sealing issues or assembly problems, SPC will challenge even your strongest problem solvers.
Measurement Systems Matter
Let me make the scenario even more difficult: your measurement system also includes errors and tolerances.
- Are your people calibrating scales periodically?
- Is the Quality Technician zeroing the scale correctly every time?
- How often do they copy the wrong number? P.S.: This reminds me of a funny (or tragic) episode I witnessed: an operator was filling quality forms with "16 oz" after "16 oz." When I asked, "Where is your scale?" she answered, "I don't need one. It is already printed on every bag: 16 oz!"
- Do you rely on visual inspection and assume the inspector's judgment does not change over time, from Monday to Friday, or from the beginning to the end of a shift? Inspectors do not experience fatigue? How often do you train and realign them?
- What is the measurement error when you measure temperature, pH, moisture, and all other dimensions your customers may require?
The Six Sigma community will ask, in one voice: where is your MSA (Measurement System Analysis) and Gage R&R? Most Green Belts I have met disliked MSA because their projects often failed at that point. But think about it for a moment: what is the point of running a project if the result cannot be measured trustfully?
How AI Changes the Inspection Model
Maneva VITA changes that scenario completely. AI can function as a tireless Quality Technician that observes 100% of products. In that context, much of the discussion about sample size becomes obsolete because we are no longer relying on probabilities created by partial inspection. If I am monitoring every single bag on my line, the average bag weight becomes just a reporting number, and giveaway is directly totaled rather than extrapolated. This is the prevention loop I described in the previous post, now applied to the specific problem of quality inspection.
We are still working with probabilistic models, but the nature of the probability changes. In the classical approach, we deal with the probability of catching a defect. Because AI observes every event, we instead deal with the probability that the AI will make the correct decision.
Minimal Sampling Size to Catch One Defect
Sample Size Versus AI Accuracy
Because Maneva VITA typically delivers accuracy of about 99.9% across most AI models, that tradeoff is highly favorable for the customer, since traditional inspection rarely checks the large number of samples shown in the table.
Furthermore, AI offers additional advantages because of how the model is defined and managed.
The Confusion Matrix: Managing the Tradeoff
For a binary classifier, such as defect/no defect, spam/not spam, or sick/healthy, every prediction falls into one of four categories:
Intuition for each cell:
- TP (True Positive): model said "defect", it really was a defect. Correct catch.
- TN (True Negative): model said "no defect", it really was fine. Correct pass.
- FP (False Positive): model said "defect", but it was actually fine. False alarm. Also called a Type I error.
- FN (False Negative): model said "no defect", but it was defective. Missed defect. Also called a Type II error.
Accuracy: Useful, but Not Enough
Accuracy is the most intuitive metric, the proportion of all predictions the model got right:
Accuracy = (TP + TN) / (TP + TN + FP + FN)
In plain English: out of everything the model predicted, how often was it correct?
Because the model operates within the Confusion Matrix, the user can make deliberate decisions about the tradeoff between false positives and false negatives.
Typically, in a probabilistic manual inspection mode, we are primarily concerned with false negatives: products that were not checked and may eventually reach the customer with defects. Unless the company creates mechanisms that allow verified out-of-spec products to continue forward, all positive signals are rejected. With AI, we can modulate that feedback, allowing some controlled level of false positives and false negatives. The customer can now make a strategic decision based on rework costs, brand image, customer risk, and the correct threshold for the specific case.
A Practical Comparison: Sampling Versus AI
Let's return to the example of a factory producing one product every second and checking one product every half hour for nonconformities. The team may be proud of a 99% quality performance, but consider the following:
In any 30-minute window:
- Produced goods: 60 × 30 = 1,800
- Expected defective: 1% × 1,800 = 18 defective
- Products inspected: 1
Measured against all 1,800 produced goods in that window, the current system performs as follows:
This exposes the exact issue discussed earlier: the current system achieves 99% accuracy by essentially never flagging anything, while catching virtually zero real defects. It is the "always predict good" baseline in disguise.
Since the current system has approximately 0.056% recall, AI only needs recall greater than 0.056% to perform better at catching defects, an almost trivially low bar. Any functional AI system clears this immediately.
Where AI Starts Creating Value
The more meaningful question is: at what accuracy does AI quality inspection provide real operational value without creating too many false alarms?
For AI checking all 1,800 bags with 90% recall (catches 16 of 18 defective bags):
Notice that even at 99% accuracy, AI catches approximately 16 defective goods per 30 minutes versus the current system catching essentially zero, while generating about 16 false alarms, products that require a second look but ultimately turn out to be acceptable.
A 99% accurate AI system is roughly 1,600x better than the current sampling scheme in terms of recall (90% versus 0.056%), even though both may appear to show approximately the same accuracy on paper.
Tuning AI to Business Risk
The right balance depends on what a missed defect costs versus what a false alarm costs in your operation:
Conclusion: From Sampling Risk to Controlled Risk
This is the real paradigm shift: quality control moves from calculating how many samples are "enough" to observing every product and deciding how strict Maneva VITA should be. Instead of accepting the blind spots created by partial inspection, the customer can define the operating point that best fits the business risk. This is the same argument I made about AI as the CI agent's assistant in Lean Six Sigma Meets AI, now applied to the specific case of quality sampling. Maneva can be tuned to aggressively filter defects, protecting customers, compliance, and brand image. Or it can be adjusted to reduce unnecessary rejection, rework, and operational cost. That decision becomes a controllable parameter, not a full rewrite of Quality SOPs, inspection rules, and sampling strategy.
And this matters because traditional inspection still depends heavily on people, and people are not sensors. They get tired. Their judgment shifts. Their consistency changes from the beginning of a shift to the end, from Monday to Friday, and from one inspector to another. In visual inspection, human performance often falls to approximately 70 to 85% accuracy. When Maneva's Video-to-Action AI can observe 100% of production with consistent decision logic, the question is no longer whether AI belongs in quality inspection. The better question is how much risk a business is willing to continue accepting without it. Book a demo at maneva.ai to see VITA quality inspection on a live line.